Executive Summary
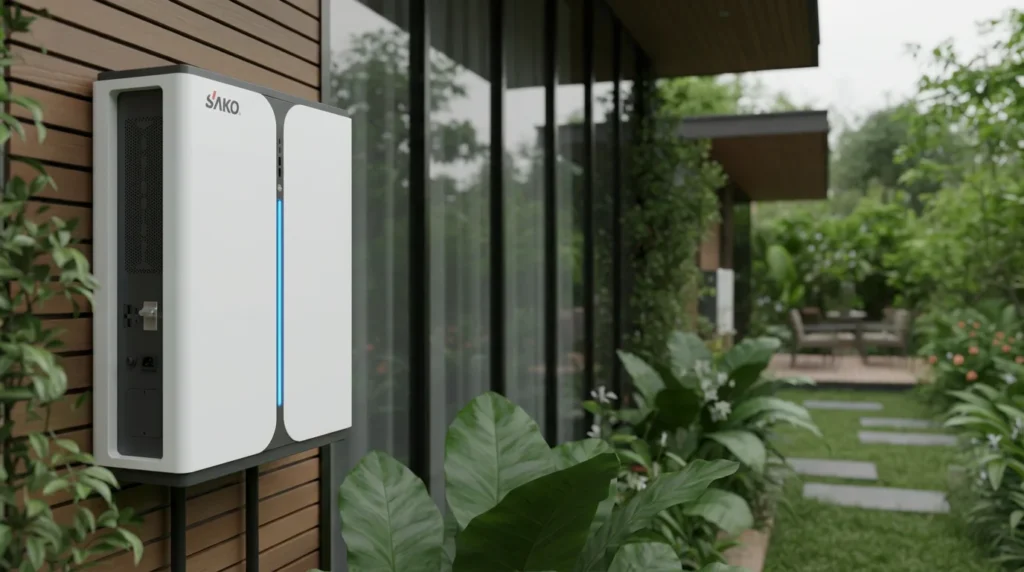
In the diverse and climatically demanding markets of the Middle East, Africa (MEA), and Southeast Asia (SEA), Residential Energy Storage Systems (RESS) have transcended their role as luxury amenities to become essential infrastructure. For consumers in South Africa or Vietnam, the value proposition is tri-fold: Energy Independence from erratic national grids, Cost Savings via arbitrage against rising tariffs, and Critical Backup during load shedding.
However, the hardware—the battery cells—is only half the equation. The core driver of efficiency, longevity, and safety is the Battery Management System (BMS). This report analyzes how BMS architectures are evolving to meet the twin challenges of extreme ambient temperatures and grid instability. We demonstrate that sophisticated BMS strategies like active balancing, thermal-synergy, and AI-driven logic function not just as safety mechanisms, but as primary financial assets that lower the Total Cost of Ownership (TCO) by preserving expensive battery chemistry against the harsh environments of the target regions.
1. The “How” – Technical Implementation Deep Dive
In the scorching heat of the UAE or the humid tropics of Indonesia, standard BMS protocols fail. The “How” of efficiency lies in the BMS acting as a dynamic brain that mitigates the physics of resistance and degradation.
1.1 The Physics of Inefficiency
Battery efficiency is ruled by internal resistance (R_int). During charging or discharging, energy is lost as heat. This relationship is described by the Joule heating formula, where the power loss (P_loss) is calculated by squaring the current (I) and multiplying it by the internal resistance (R_int).
In MEA/SEA, high ambient temperatures accelerate the growth of the Solid Electrolyte Interphase (SEI) layer in Lithium-ion cells, permanently increasing the internal resistance (R_int). A simplified efficiency model for the BMS to monitor is the Round-Trip Efficiency (RTE). The RTE is calculated as the ratio of the total energy discharged from the battery to the total energy used to charge it, expressed as a percentage. In more technical terms, it is the integral of the discharge power over a given time period divided by the integral of the charging power over the same period.
A superior BMS minimizes the denominator (energy in) required for a specific numerator (useful energy out) by optimizing current flow (I) relative to instantaneous cell temperature.
1.2 Battery Balancing Technology: The Efficiency Divider
Inconsistent cell voltages reduce usable capacity—a “weak” cell dictates when the whole pack stops charging. In MEA/SEA, thermal gradients often cause faster cell drift.
Table 1: Comparative Analysis – Active vs. Passive Balancing
| Feature | Passive Balancing | Active Balancing |
|---|---|---|
| Mechanism | Dissipates excess energy from high-voltage cells as heat via resistors. | Transfers energy from high-voltage cells to low-voltage cells via inductors/capacitors. |
| Charging Efficiency Gain | Baseline (Wastes ~3-5% energy as heat). | +5% to +10% (Recovers energy). |
| Impact on SOH | Negative/Neutral: Generates more heat inside the pack, dangerous in >40°C climates. | Positive: Reduces thermal stress and keeps cells strictly aligned. |
| System Cost | Low ($10–$20/kWh implied). | Moderate/High (+$30–$50/kWh implied). |
| Suitability for MEA/SEA | Low. The added heat load strains thermal management systems in hot climates. | High. Critical for maximizing yield in solar-limited systems and hot environments. |
1.3 BMS-Thermal Synergy and Control Logic
The BMS must collaborate with the Thermal Management System (TMS). In high-temperature zones, the goal is not just cooling, but smart cooling that balances parasitic power consumption (fans/pumps) against battery health preservation.
BMS Thermal Safety Logic Flow (ASCII Visualization):
[Sensor Input: T_cell = 48°C]
       |
       v
[BMS Decision Node: Is Grid State Critical?]
       |
       +--- YES (Outage Mode) ---> [Action: Activate Liquid Cooling Max]
       |                           [Action: Does NOT derate current (Priority: Power)]
       |
       +--- NO  (Normal Mode) ---> [Action: Initiate Charging Derate (Reduce I by 20%)]
                                   [Action: Activate Eco-Cooling Mode]
                                   [Reason: Reduces I²R losses + extends SOH]
Table 2: Thermal Management Decision Matrix for Hot Climates
| Technology | Cooling Effectiveness (W/°C) | Parasitic Load (%) | Reliability (Dust/Humidity) | Suitability for MEA/SEA |
|---|---|---|---|---|
| Passive Air | Low (< 5) | 0% | High (Sealed) | Low. Cannot handle 45°C ambient. |
| Forced Air | Medium (10-20) | 1-2% | Low (Filters clog with sand/dust). | Medium. Requires maintenance. |
| Liquid Cooling | High (> 30) | 2-4% | High (Closed loop). | Best. Essential for long life in deserts. |
2. The Economic Reality – Total Cost of Ownership (TCO)
For analysts and investors, the technical superiority of a BMS must translate into financial metrics. A cheap system with a basic BMS may fail within 5 years in Riyadh or Manila, whereas a premium active-balancing system may last 12.
Assumptions for TCO Model:
- Location: Representative SEA Metro (e.g., Bangkok).
- Electricity Price: $0.15/kWh (blended grid rate), escalating 3% annually.
- System Size: 10 kWh.
- Degradation Curve Source: NREL & Manufacturer accelerated aging data (Premium BMS = 0.5% degradation/year vs. Standard = 1.5%/year in heat).
Table 3: 15-Year TCO Model – Standard vs. Premium BMS
| Cost Category | Standard System (Passive BMS, Air Cooled) | Premium System (Active BMS, Liquid Cooled) | Delta (Financial Impact) |
|---|---|---|---|
| CAPEX (Initial) | $3,500 ($350/kWh) | $5,000 ($500/kWh) | Premium costs $1,500 more. |
| OPEX (Cooling/Maintenance) | $500 (Filter changes, fan replacement) | $200 (Coolant check) | $300 Savings. |
| Battery Replacement | $2,500 (Required at Year 7 due to heat/imbalance) | $0 (Lasts full 15 years @ 70% SOH) | $2,500 Avoided Cost. |
| Efficiency Losses (Cost of Lost Energy) | $1,200 (90% RTE over lifetime) | $400 (96% RTE over lifetime) | $800 Savings. |
| Total Cost of Ownership | $7,700 | $5,600 | Premium System is $2,100 Cheaper. |
Sensitivity Note: If ambient temperatures drop (temperate climate), the “Standard” system becomes more viable. However, in MEA/SEA heat, the CAPEX premium for better BMS/Thermal tech pays for itself through avoided replacement costs.
3. Market & Strategic Insight – MEA & SEA Focus
3.1 Policy Landscapes and BMS Requirements
Government policy dictates the algorithm. A BMS in Vietnam (FiT driven) behaves differently than one in South Africa (backup driven).
Table 4: Regional Policy Snapshot & BMS Implications
| Country | Key Policy/Driver | Grid Service Opps | Key Barrier | BMS Implication |
|---|---|---|---|---|
| South Africa | Load Shedding (ESKOM instability). | Limited (Market opening). | High interest rates. | Logic: Keep SoC reserve high (e.g., never below 40%) for unpredictable outages. |
| UAE / Saudi Arabia | Vision 2030 / Heavy Renewables. | High (VPP pilots). | Low electricity subsidies. | Logic: Peak shaving algorithms to manage A/C loads during high heat. |
| Vietnam | Post-FiT Solar Boom. | Low currently. | Grid saturation. | Logic: Zero-export limitation requires BMS to throttle solar inverter precisely. |
| Philippines | Island Grids / High Rates. | Frequency Regulation. | Complex interconnects. | Logic: Robust “Islanding” capability and rapid frequency response. |
3.2 Competitive Landscape and Case Studies
The market is bifurcated between integrated giants and battery assemblers.
- Tesla (Global Leader): Uses liquid cooling and a proprietary BMS that focuses on data aggregation. In MEA, their “Storm Watch” mode (predictive charging before bad weather/outage) is a key differentiator.
- BYD (China/Global): The “Blade Battery” pairs with a BMS optimized for LFP chemistry. Their advantage in SEA is the “vertical integration” model—making chips, BMS, and cells—allowing for extremely competitive pricing on liquid-cooled units ($300-$400/kWh ranges).
- Huawei (Proprietary Optimizers): Instead of just pack-level BMS, they utilize packet-level optimization, claiming 5-10% more energy yield, crucial for the shaded/dusty rooftops of the MEA region.
Table 5: Competitor Strategy Matrix
| Company | Flagship | BMS Strategy | Key MEA/SEA Differentiator | Market Tier |
|---|---|---|---|---|
| Tesla | Powerwall 3 | In-House / AI-Cloud | Aesthetics & Software UX | Premium |
| BYD | Battery-Box | Vertical Integration | High Temp LFP Performance | Mass Market |
| Sunwoda | Residential ESS | OEM/Third-Party | Aggressive Cost Leadership | Entry Level |

4. Consumer & Buyer Guide
For the homeowner in Lagos or Kuala Lumpur, the technical specs must translate to trust.
The “Brain” Analogy:
Think of the battery cells as the “muscles”—strong but dumb. The BMS is the “brain.” In 40°C heat, a dumb brain keeps working the muscles until they tear (thermal runaway or degradation). A smart brain (Premium BMS) tells the muscles to rest or drink water (activates cooling) so they can work for 10 years instead of 5.
Buyer’s Decision Checklist:
- [ ] Balancing Type: Ask explicitly: “Does this use Active Balancing?” (Preferred for longevity).
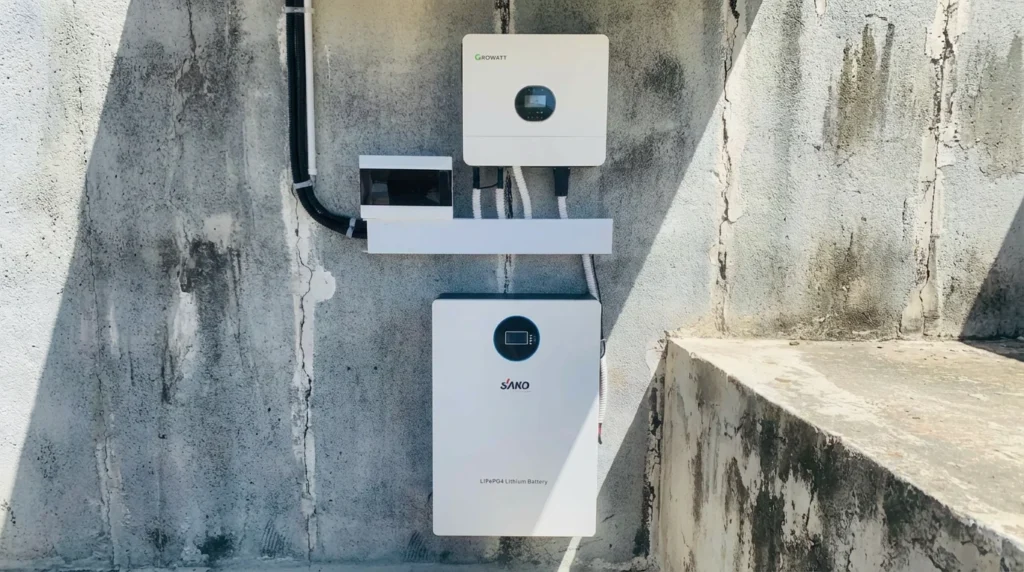
- [ ] Cooling: “Is this passive air cooled or liquid/forced air?” Avoid passive cooling if your unit will be installed outdoors in MEA/SEA.
- [ ] The Warranty Trick: Look at the “Throughput Warranty.” A company confident in their BMS efficiency will warranty Total Energy Throughput (MWh), not just “Years.”
- [ ] Blackout Recovery: “Does the BMS have ‘Black Start’ capability?” Can it wake up from a dead solar charge during a grid outage? (Essential for South Africa/Lebanon).
5. Forward-Looking Analysis: What’s Next?
AI and Predictive Maintenance:
The next frontier is AI-driven BMS. By analyzing usage patterns and weather forecasts, the BMS will pre-cool the battery before the midday heat spikes in Riyadh, reducing thermal stress.
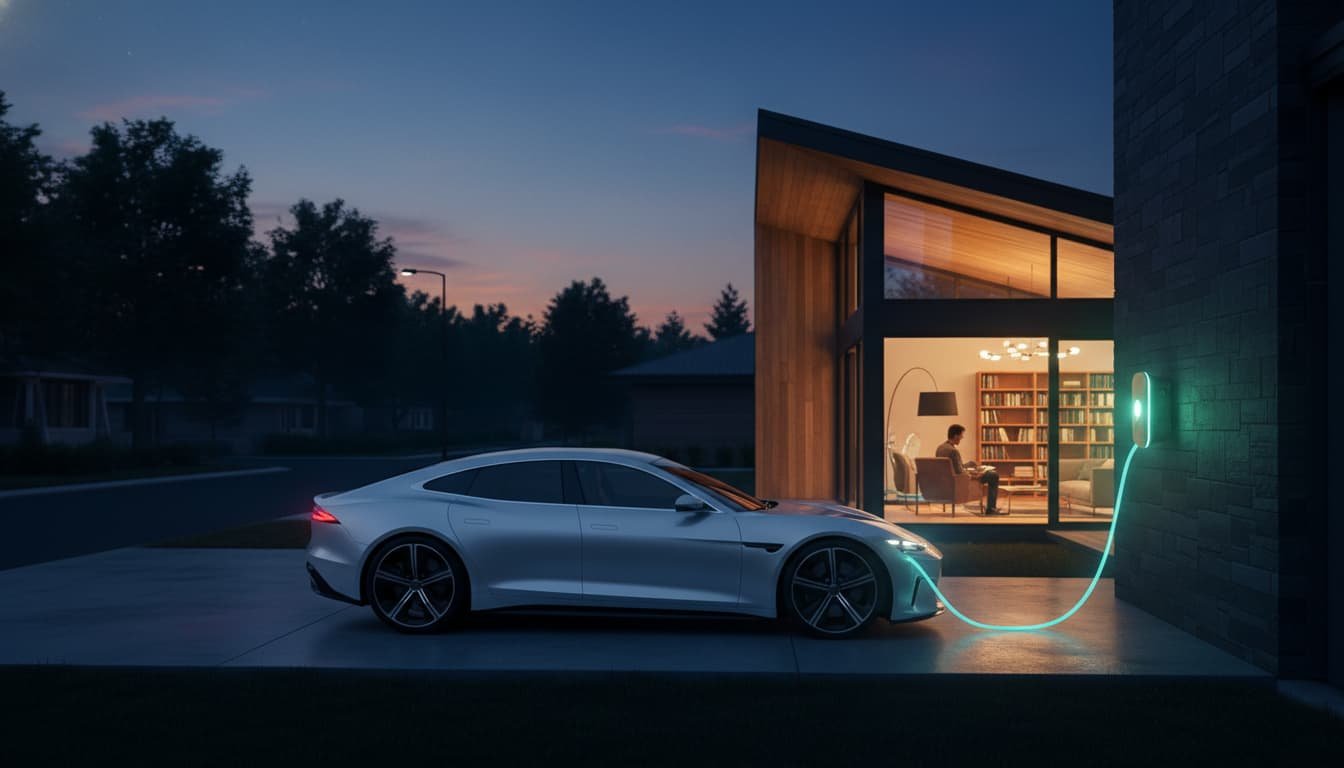
V2G (Vehicle-to-Grid) in Weak Grids:
In SEA, where scooter/EV adoption is rising, the BMS will evolve to manage bi-directional flow. The home battery BMS will act as the “Master,” coordinating with the EV’s BMS to stabilize the home voltage during brownouts, effectively creating a microgrid.
References & Methodologies
- Financial Models: Derived from standard Discounted Cash Flow (DCF) methods using CAPEX data from BloombergNEF 2024 Energy Storage Outlook.
- Technical Standards: Safety and performance claims validated against IEC 62619 (Industrial/Residential Safety) and UL 9540A (Thermal Runaway).
- Degradation Data: Arrhenius equation principles applied to LFP chemistry degradation rates sourced from National Renewable Energy Laboratory (NREL) degradation studies.
- Market Data: Policy and market share insights adapted from Wood Mackenzie Power & Renewables reports (Q1-Q3 2024).
Disclaimer: This report is for informational purposes. TCO models are sensitive to local installation costs and tariff changes. Always consult with a certified engineer for specific project feasibility.