1. Executive Summary
The Emerging Market (EM) home energy storage sector faces a “Commodity Trap.” Markets in the Middle East, Africa, and Southeast Asia are flooded with low-cost, low-reliability generic hardware. New entrants attempting to compete primarily on price in Year 1 will face a race to the bottom that erodes margins and destroys brand equity.
This report outlines a divergent “Sequential Strategy[^5].” Instead of immediate mass scaling, we propose a two-phase approach:
- Phase 1 (Years 1-2): Establish an unassailable reputation for reliability through a “Value-Entry” product and a strictly controlled “Certified Empowerment” channel.
- Phase 2 (Years 3-5): Leverage brand equity to launch a mass-market “Low-Cost Entry” product, utilizing the Phase 1 channel as the training backbone for rapid scaling.

2. Phase 1: The Foundation (Years 1-2) — Building the Replicable Model
The objective of Phase 1 is not maximum market share, but maximum Market Trust[^1].
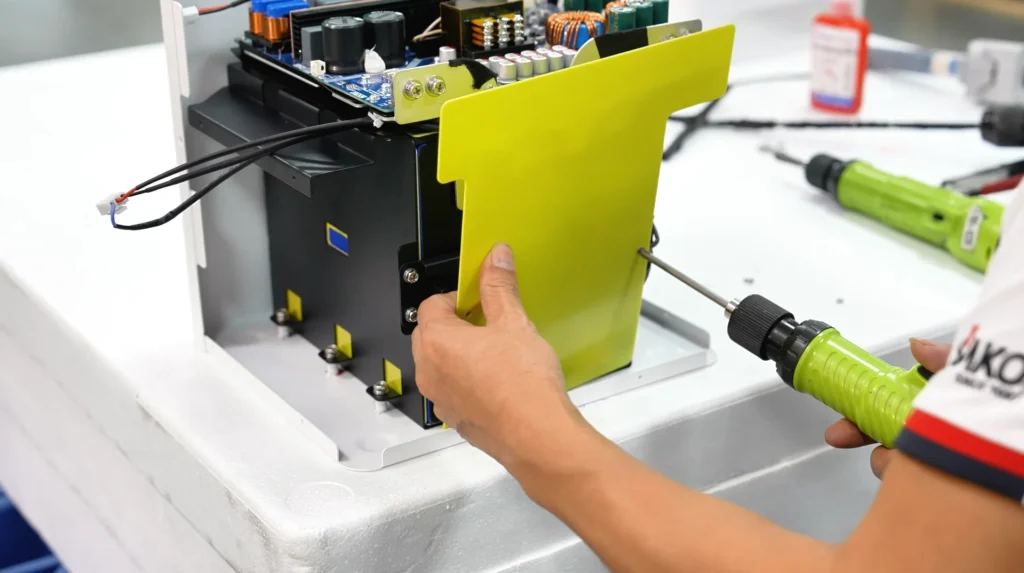
2.1 Product Strategy: The “Resilience” Line
The Phase 1 product acts as the “Value-Entry” option. It is not the cheapest on the shelf, but it is the cheapest reliable source of power over a 5-year period.
- Chemistry: Lithium Iron Phosphate (LFP) – Essential for thermal stability in MEA climates (up to 45°C safety margin) and cycle life (3000+ cycles at 80% DoD).
- BMS Logic: Over-engineered Battery Management System (BMS) with active balancing to handle frequent, erratic grid surges common in Nigeria and Vietnam.
2.2 Quantitative Rigor: 5-Year Total Cost of Ownership (TCO) Model
We must prove to the customer that a $1,500 generic system is more expensive than our $2,200 system.
Market Scenario: Lagos, Nigeria (Small SME / Upper-Middle Class Home).
Assumptions:
- Grid Availability: 12 hours/day.
- Outage frequency: Daily.
- Diesel Cost: $1.10/Liter (trend increasing).
- Grid Tariff: $0.15/kWh.
- Competitor Product: Lead-Acid or Low-Grade Ternary Lithium (1.5-year lifespan under heavy load; 2 replacements required in 5 years).
- Our Product: LFP “Resilience” Unit (10-year design life, 0 replacements).
5-Year TCO Comparison Table:
| Cost Variable | Cheap Competitor (Generic AGM/Gel) | Our “Value-Entry” (Resilience LFP) | Variance (Savings) |
|---|---|---|---|
| Year 0: Upfront Hardware | $1,500 | $2,200 | (-$700) |
| Year 0: Installation | $100 (Uncertified) | $250 (Certified Audit) | (-$150) |
| Year 2: Replacement 1 | $1,200 (Battery failure) | $0 | +$1,200 |
| Year 4: Replacement 2 | $1,200 (Battery failure) | $0 | +$1,200 |
| 5-Year Diesel Backup | $2,500 (Due to system downtime) | $500 (High uptime) | +$2,000 |
| System Efficiency Loss | 20% Energy Loss | 5% Energy Loss | +$200 (Grid savings) |
| TOTAL 5-YEAR COST | $6,500 | $2,950 | +$3,550 |
Conclusion: Our solution delivers a 54% reduction in TCO, despite a 46% higher upfront cost. Phase 1 marketing focuses exclusively on this “Pay Once, Power Always” math.
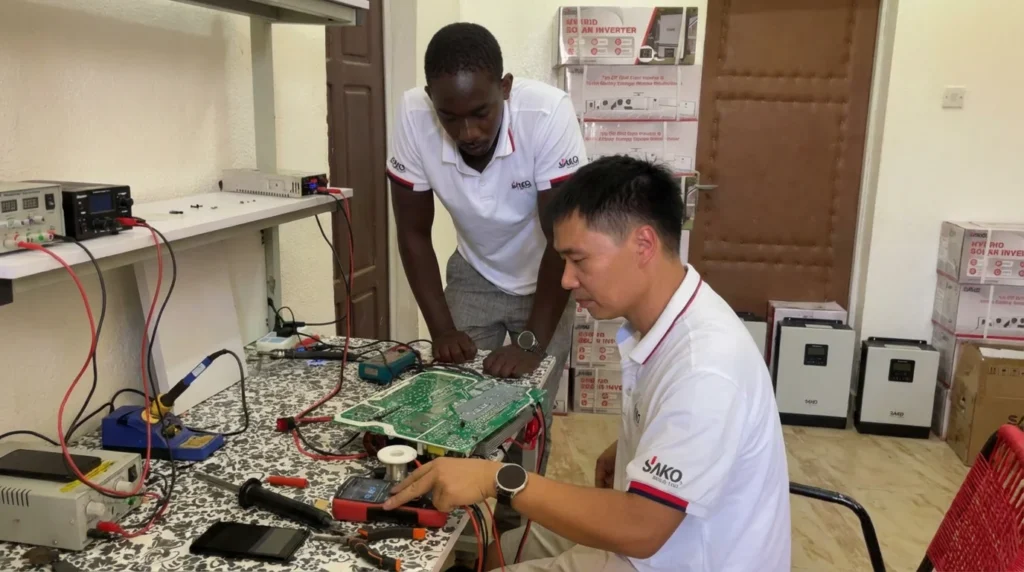
2.3 Channel Strategy: The “Certified Empowerment” Model
We cannot sell a high-quality product through low-quality installers.
Phase 1 relies on an exclusive network.
Empowerment Framework:
| Component | Selection Criteria | Training Curriculum (The Academy) | Support Package (The Carrot) |
|---|---|---|---|
| Installer Persona | • Must own an existing electrical business >2 years. |
- Min. 2 staff members.
- Existing tools inventory check.
- Reference check for business ethics. | Technical:
- DC coupling specifics.
- Surge protection protocols (Grid instability).
- Remote monitoring setup.
Business: - How to sell TCO vs. Upfront Price.
- Inventory cash flow management. | Tier 1 Support:
- Direct access to Level 3 Engineering hotline (no bots).
- Co-branded uniforms and vehicle wraps.
- Stock Credit: Net-30 terms after first 5 installs.
- Geographic exclusivity (radius protection). |
Pilot KPIs for Validation:
- System Uptime: >99.8% (monitored remotely).
- Installer Margin: Certified partners must see a 20% Net Profit margin on our hardware to ensure loyalty.
- NPS: Customer Net Promoter Score >70 (World Class).
3. Phase 2: The Scaling (Years 3-5) — Achieving Market Leadership
Once the brand signifies “unbreakable quality” (validated by Phase 1), we execute the pivot. We introduce a “Legacy” Product Line—a cost-optimized system designed for mass adoption, priced to compete with mid-tier competitors but carrying our premium badge.
3.1 Scaling Logic
- Product: “Legacy Series.” Minimalist aesthetics, streamlined I/O ports, slightly lower cycle rating (but still LFP), 20% cost reduction in BOM.
- Channel Multiplier: We do not recruit thousands of new installers directly. We pay our Phase 1 “Elite” installers to become Master Trainers and Regional Distributors. They vet the new wave, creating a pyramid of quality control.
3.2 Visual Mandate: Logistics & Supply Chain Flowchart
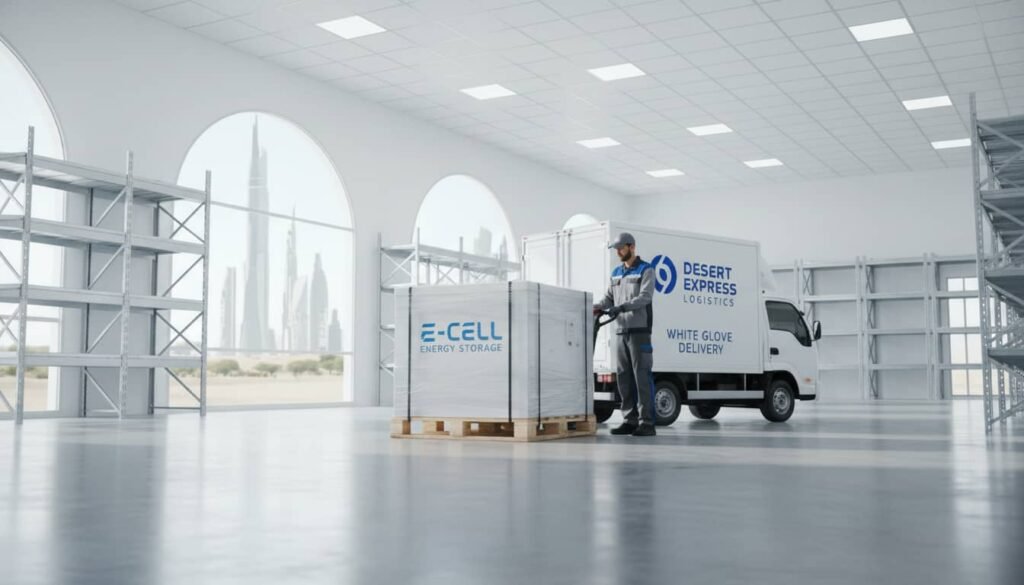
The logistical requirements shift from “White Glove” to “High Velocity.” The strategic evolution of the supply chain can be broken down into two distinct phases:
- Phase 1: The Foundation (Low Volume, High Complexity, Direct Control)
- Flow: Products move from the HQ Factory to a Regional Hub (e.g., Dubai) for an initial quality control check.
- Distribution: Direct shipment from the hub to an Elite Certified Installer.
- Installation: The installer performs mandatory on-site configuration for the end customer.
- Feedback: A direct data feedback loop is established from the customer back to the HQ for research and development.
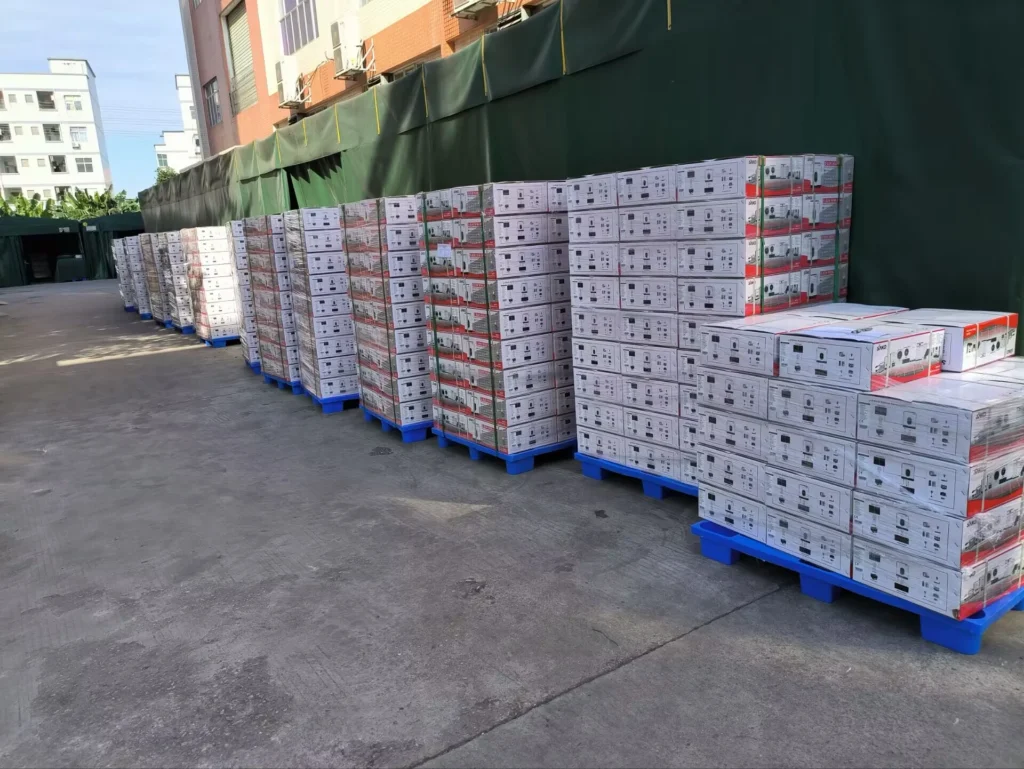
- Phase 2: The Scaling (High Volume, Streamlined, Decentralized)
- Flow: Products are sent from the HQ Factory to a Mass Distribution Center in a key market (e.g., Lagos or Jakarta).
- Distribution: The model becomes decentralized, supplying multiple National Distributors.
- Supply Chain Leg: Distributors move bulk pallets to Elite Partners, who act as regional hubs.
- Training Leg: These Elite Partners are responsible for training a wider network of Standard Installers, transferring knowledge and quality standards.
- Market Reach: The network of Standard Installers serves the mass market.
4. Risk Analysis & Financial Projections
4.1 Key Risks & Mitigation
The primary risk of a sequential strategy is providing competitors a 2-year head start on market share.
| Risk Category | Specific Threat | Mitigation Strategy |
|---|---|---|
| Market Share | Competitors capture 80% of volume in Years 1-2 with cheap product. | The “Boomerang Effect”: Cheap units will fail by Year 3. We position our Phase 2 launch to coincide with the replacement cycle of competitor failures. We market upgrades, not just new installs. |
| Channel Leakage | Certified Installers use our training to sell cheaper competitor products. | Software Lock-in: Our commissioning app is required for warranty activation. Installers lose access to the “Lead Gen Dashboard” if they become inactive or sell non-approved hardware. |
| Currency Risk | Local currency devaluation (e.g., Nigerian Naira, Egyptian Pound) crushes margins. | Local Assembly (CKD): Move to Completely Knocked Down (CKD) assembly in Phase 2 to reduce import duties and hedge against currency by sourcing casing/cabling locally. |
4.2 Financial Projection: The “J-Curve”
This strategy requires patience. We expect negative or flat cash flow in Phase 1 due to heavy investment in training infrastructure, followed by exponential growth in Phase 2.
- Years 1-2:
- Volume: Low.
- Gross Margin: High (Premium Pricing).
- Opex: High (Training Teams, Boots on Ground).
- Net Result: Burn Phase.
- Years 3-5:
- Volume: High (10x multiplier).
- Gross Margin: Medium (Scale Product).
- CAC: Low (Referral driven).
- Net Result: Profitability/Harvest Phase.
5. Trust Anchors, Standards & Methodologies
To execute this authoritative strategy, all product and training literature will be anchored in recognized international standards rather than vague marketing claims.
- IEC 62619: Safety requirements for secondary lithium cells for industrial use. This is our non-negotiable safety pass for the battery pack.
- IEC 62133: Safety requirements for portable sealed secondary cells.
- UN 38.3: Transport certification (essential for logistics in fragmented archipelagos like Philippines/Indonesia).
- Local Grid Codes:
- South Africa: NRS 097-2-1 (Grid Interconnection).
- Nigeria: NERC Mini-Grid Regulations.
- Vietnam: EVN Solar Technical Standards.
Methodology Note: The TCO model assumes a discount rate of 10% for emerging markets and utilizes historical grid reliability data from the World Bank Energy Progress Report (2022) to estimate generator run-times.
6. Conclusion
Entering MEA and SEA with a “cheap” product is a race to zero. Entering with a “luxury” product is a niche trap. The Sequential Strategy[^5] bridges the gap. We build the infrastructure of trust in Phase 1, so that in Phase 2, we are not just selling a battery; we are selling the only validated guarantee of power in an unstable world.
We request approval for the $X Million seed tranche to operationalize the Phase 1 Pilot in [City A] and [City B].
[^1]: Understanding Market Trust can help businesses build credibility and customer loyalty in competitive markets.
[^2]: Exploring TCO models can reveal how long-term savings influence purchasing choices in energy solutions.
[^3]: This model emphasizes quality and training, ensuring high standards in energy product installations.
[^4]: LFP batteries are known for their safety and longevity, making them a popular choice in energy storage.
[^5]: The Sequential Strategy outlines a phased approach to building brand equity and market presence effectively.